Detailed borrowings information
The principal economic terms and conditions of outstanding borrowings for both United Utilities Group PLC and United Utilities Water Limited, along with fair values and carrying values, are set out below.
Totals in these tables reconcile to the audited financial statements of each entity, which can be found here United Utilities Group PLC and here United Utilities Water Limited, however the detail as presented below is unaudited.
United Utilities Group PLC (unaudited)
| United Utilities Group PLC (unaudited) | Currency | Year of final repayment | Fair Value March 2025 £m | Carrying Value March 2025 £m | Fair Value March 2024 £m | Carrying Value March 2024 £m |
|---|---|---|---|---|---|---|
| Borrowings in fair value hedge relationships | - | - | 3816.8 | 3797.2 | 3,459.0 | 3,414.6 |
| 2% 340m bond | GBP | 2025 | 331.5 | 328.4 | ||
| 2.867% 320m bond | HKD | 2026 | 31.6 | 31.9 | 31.2 | 31.8 |
| 2.92% 739m bond | HKD | 2026 | 72.6 | 73.6 | 71.9 | 73.4 |
| 1.129% 52m bond | EUR | 2027 | 42.1 | 42.4 | 42.0 | 41.7 |
| 2.37% 830m bond | HKD | 2027 | 79.1 | 81.5 | 80.4 | 80.4 |
| 5.625% 300m bond | GBP | 2027 | 309.9 | 302.6 | 312.6 | 304.4 |
| 1.43% 100m bond | GBP | 2028 | 89.6 | 89.9 | 87.3 | 87.6 |
| 5.02% JPY 10bn dual currency loan | JPY/USD | 2029 | 60.4 | 62.7 | 64.3 | 66.9 |
| 0.875% 300m bond | GBP | 2029 | 251.3 | 256.9 | 245.1 | 251.6 |
| 2.058% 30m bond | EUR | 2030 | 23.5 | 23.4 | 23.7 | 23.4 |
| 0.175% 11bn bond | JPY | 2030 | 51.9 | 53.6 | 54.2 | 55.2 |
| 2.625% 425m bond | GBP | 2031 | 369.2 | 362.4 | 372.3 | 361.2 |
| 1.641% 30m bond | EUR | 2031 | 22.7 | 22.5 | 22.9 | 22.4 |
| 2.9% 600m bond | HKD | 2031 | 57.5 | 55.8 | 58.3 | 54.0 |
| 1.474% 35m bond | USD | 2031 | 21.4 | 22.1 | 20.9 | 21.6 |
| 1.707% 28m bond | EUR | 2032 | 19.7 | 21.4 | 20.7 | 21.5 |
| 1.653% 26m bond | EUR | 2032 | 18.1 | 19.5 | 19.0 | 19.6 |
| 1.70% 30m bond | EUR | 2033 | 20.8 | 22.9 | 21.9 | 23.0 |
| 3.50% 650m bond | EUR | 2033 | 533.3 | 529.4 | - | - |
| 2.0% 350m bond | GBP | 2033 | 78.0 | 76.9 | 80.3 | 79.1 |
| 3.75% 825m bond | EUR | 2034 | 698.5 | 681.3 | 560.7 | 553.8 |
| 5% 200m bond | GBP | 2035 | 187.2 | 198.5 | 201.0 | 207.1 |
| 4.95% 1.5bn bond | NOK | 2035 | 114.3 | 104.8 | - | - |
| 5.75% 400m bond | GBP | 2036 | 408.4 | 394.9 | 442.1 | 414.6 |
| 1.45% 8.5bn bond | JPY | 2037 | 38.6 | 40.9 | 43.3 | 43.4 |
| 5.25% 400m bond | GBP | 2046 | 217.1 | 225.4 | 251.4 | 248.5 |
| Borrowings designated at fair value through profit and loss | - | - | 330.2 | 330.2 | 338.9 | 338.9 |
| 6.875% 400m bond | USD | 2028 | 330.2 | 330.2 | 338.9 | 338.9 |
| Borrowings measured at amortised cost | - | - | ||||
| Short-term bank borrowings - fixed | GBP | 2026 | 37.1 | 37.1 | 37.8 | 37.8 |
| 0.49%+RPI 100m IL Loan | GBP | 2025 | 147.1 | 147.8 | ||
| 0.013%+RPI 25m IL bond | GBP | 2025 | 38.2 | 38.2 | 36.4 | 36.9 |
| 0.1275%+RPI 100m IL Loan | GBP | 2026 | 150.3 | 151.1 | 143.2 | 145.8 |
| 0.01%+RPI 20m IL bond | GBP | 2028 | 28.7 | 30.4 | 27.5 | 29.5 |
| 1.23%+RPI 50m EIB (amortising) IL loan | GBP | 2029 | 27.9 | 24.5 | 29.4 | 29.5 |
| 0.288%+CPI 100m IL loan | GBP | 2029 | 118.3 | 126.8 | 114.1 | 123.1 |
| 1.29%+RPI 50m EIB (amortising) IL loan | GBP | 2029 | 30.9 | 27.3 | 32.4 | 32.2 |
| 1.12%+RPI 50m EIB (amortising) IL loan | GBP | 2029 | 30.6 | 27.1 | 32.0 | 32.0 |
| 1.10%+RPI 50m EIB (amortising) IL loan | GBP | 2029 | 30.5 | 27.1 | 31.9 | 31.9 |
| 0.75%+RPI 50m EIB (amortising) IL loan | GBP | 2029 | 32.6 | 29.4 | 33.8 | 34.1 |
| 0.76%+RPI 50m EIB (amortising) IL loan | GBP | 2030 | 32.5 | 29.3 | 33.6 | 34.0 |
| 1.15%+RPI 50m EIB (amortising) IL loan | GBP | 2030 | 32.6 | 29.2 | 33.7 | 33.9 |
| 1.11%+RPI 50m EIB (amortising) IL loan | GBP | 2030 | 32.6 | 29.3 | 33.8 | 34.0 |
| 0.780%+SONIA 100m loan | GBP | 2030 | 99.3 | 99.9 | 100.6 | 99.8 |
| 0.178%+RPI 35m IL bond | GBP | 2030 | 50.5 | 53.6 | 49.5 | 51.6 |
| 0.970%+SONIA 135m loan | GBP | 2030 | 132.2 | 134.7 | 134.0 | 134.6 |
| 0.245%+CPI 20m IL bond | GBP | 2031 | 23.3 | 26.8 | 22.9 | 26.0 |
| 0.01%+RPI 38m IL bond | GBP | 2031 | 51.0 | 57.6 | 50.4 | 55.9 |
| 3.375% + RPI 50m IL bond | GBP | 2032 | 119.2 | 109.9 | 122.8 | 106.0 |
| 0.9856%+SONIA 100m EIB (amortising) loan | GBP | 2032 | 43.7 | 43.8 | 50.3 | 50.0 |
| 1.175%+SONIA 100m loan | GBP | 2032 | 100.2 | 99.8 | 101.7 | 99.7 |
| 0.940%+SONIA 150m loan | GBP | 2032 | 146.5 | 149.8 | 148.6 | 149.7 |
| 0.9676%+SONIA 150m EIB (amortising) loan | GBP | 2032 | 70.2 | 70.3 | 80.1 | 79.7 |
| 0.8496%+SONIA 100m EIB (amortising) loan | GBP | 2033 | 49.1 | 50.0 | 55.6 | 56.3 |
| 0.7876%+SONIA 150m EIB (amortising) loan | GBP | 2033 | 80.6 | 79.7 | 90.6 | 89.1 |
| 2% 350m bond | GBP | 2033 | 194.9 | 247.3 | 200.8 | 245.5 |
| 0.01%+RPI 100m EIB (amortising) IL loan | GBP | 2033 | 90.6 | 84.8 | 86.2 | 91.0 |
| 0.01%+RPI 75m EIB (amortising) IL loan | GBP | 2034 | 63.5 | 63.6 | 64.5 | 68.2 |
| 0.01%+RPI 75m EIB (amortising) IL loan | GBP | 2034 | 66.3 | 66.8 | 67.3 | 71.2 |
| 0.01%+RPI 75m EIB (amortising) IL loan | GBP | 2034 | 66.3 | 66.9 | 67.3 | 71.2 |
| 1.9799% + RPI 100m IL bond | GBP | 2035 | 186.2 | 204.4 | 201.4 | 197.4 |
| 1.1496%+SONIA 100m EIB (amortising) loan | GBP | 2035 | 66.3 | 65.6 | 73.4 | 71.9 |
| 1.1166%+SONIA 75m EIB (amortising) loan | GBP | 2035 | 52.9 | 51.6 | 58.3 | 56.2 |
| 0.01%+RPI 26.5m IL bond | GBP | 2036 | 32.1 | 41.8 | 32.3 | 40.7 |
| 0.379%+CPI 20m IL bond | GBP | 2036 | 20.9 | 26.7 | 21.6 | 26.0 |
| 0.01%+RPI 29m IL bond | GBP | 2036 | 34.2 | 44.3 | 35.5 | 42.9 |
| 0.093%+CPI 60m IL bond | GBP | 2037 | 60.3 | 79.8 | 62.2 | 77.5 |
| 1.66%+RPI 35m IL bond | GBP | 2037 | 62.4 | 66.0 | 63.8 | 63.7 |
| 1.75% 400m bond | GBP | 2038 | 249.7 | 353.3 | 219.9 | 301.8 |
| 5.125% 300m bond | GBP | 2038 | 279.4 | 297.5 | 306.3 | 297.4 |
| 2.40%+RPI 70m IL bond | GBP | 2039 | 125.2 | 128.9 | 130.8 | 124.4 |
| 1.7829% + RPI 100m IL bond | GBP | 2040 | 165.3 | 202.2 | 192.0 | 195.3 |
| 0.01%+CPI 125m IL bond | GBP | 2040 | 104.4 | 171.6 | 111.9 | 168.3 |
| 1.3258% + RPI 50m IL bond | GBP | 2041 | 76.3 | 100.9 | 87.6 | 97.4 |
| 1.5802%+ RPI 100m IL bond | GBP | 2042 | 156.0 | 201.6 | 181.1 | 194.7 |
| 1.875% 300m bond | GBP | 2042 | 168.3 | 296.0 | 191.4 | 295.8 |
| 1.5366% + RPI 20m IL bond | GBP | 2043 | 31.5 | 40.2 | 36.1 | 38.9 |
| 5.25% 400m bond | GBP | 2046 | 130.2 | 150.0 | - | - |
| 1.397% + RPI 50m IL bond | GBP | 2046 | 71.0 | 100.8 | 84.7 | 97.3 |
| 0.359%+CPI 32m IL bond | GBP | 2048 | 24.8 | 42.0 | 27.6 | 40.8 |
| 1.7937% + RPI 50m IL bond | GBP | 2049 | 75.5 | 100.3 | 91.4 | 96.9 |
| 5.75% 350m bond | GBP | 2051 | 332.0 | 336.1 | - | - |
| Commission for New Towns (amortising) loan - fixed | GBP | 2053 | 31.3 | 22.9 | 35.3 | 23.9 |
| 1.847% + RPI 100m IL bond | GBP | 2056 | 176.5 | 199.1 | 187.0 | 192.2 |
| 1.815% + RPI 100m IL bond | GBP | 2056 | 174.8 | 198.3 | 181.6 | 191.4 |
| 1.662% + RPI 100m IL bond | GBP | 2056 | 171.1 | 197.9 | 177.6 | 191.0 |
| 1.5865% + RPI 50m IL bond | GBP | 2056 | 84.7 | 98.9 | 89.6 | 95.4 |
| 1.591% + RPI 25m IL bond | GBP | 2056 | 41.4 | 49.3 | 44.6 | 47.6 |
| 1.556% + RPI 50m IL bond | GBP | 2056 | 84.3 | 98.4 | 89.2 | 94.9 |
| 1.435% + RPI 50m IL bond | GBP | 2056 | 82.6 | 98.0 | 87.2 | 94.6 |
| 1.3805% + RPI 35m IL bond | GBP | 2056 | 57.4 | 68.6 | 60.6 | 66.2 |
| 1.585% + RPI 100m IL bond | GBP | 2057 | 160.9 | 190.4 | 172.1 | 183.8 |
| 0.387%+CPI 33m IL bond | GBP | 2057 | 23.7 | 43.0 | 25.6 | 41.7 |
| 1.702% + RPI 50m IL bond | GBP | 2057 | 83.1 | 96.0 | 86.7 | 92.7 |
| Book overdrafts | GBP | 2025 | 3.6 | 3.6 | 20.0 | 20.0 |
| Lease obligations | GBP | various | 83.2 | 83.2 | 59.2 | 59.2 |
| - | - | - | 9,980.7 | 10,788.6 | 9,583.4 | 10,001.4 |
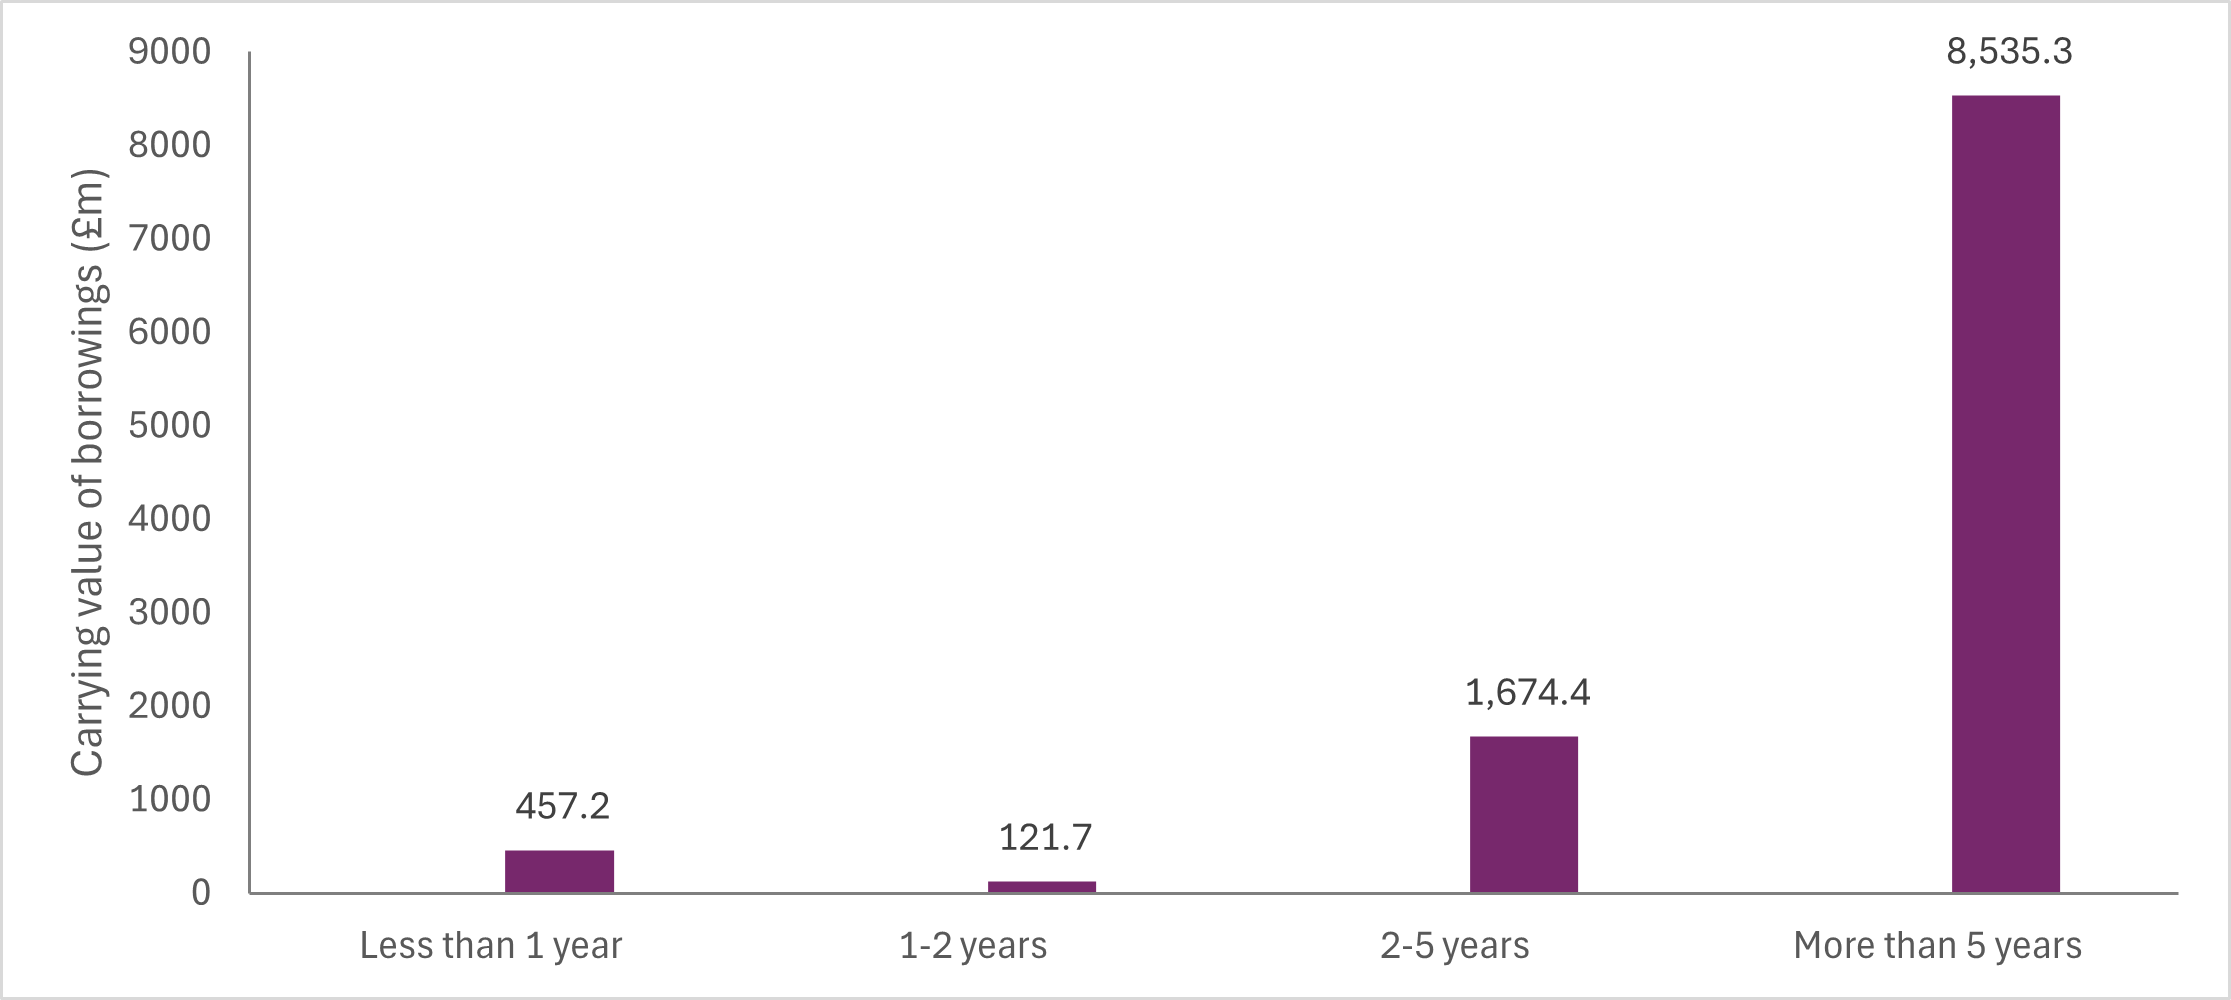
Debt maturities
United Utilities Group PLC (unaudited)
| Scheduled debt maturities (GBPm) | At 31 March 2025 |
|---|---|
| Less than 1 year | 457.2 |
| 1-2 years | 121.7 |
| 2-5 years | 1,674.4 |
| More than 5 years | 8,535.3 |
| Total | 10,788.6 |
United Utilities Water Limited (unaudited)
| United Utilities Water Limited (unaudited) | Currency | Year of final repayment | Fair Value March 2025 £m | Carrying Value March 2025 £m | Fair Value March 2024 £m | Carrying Value March 2024 £m |
|---|---|---|---|---|---|---|
| Borrowings in fair value hedge relationships | - | - | 3,816.8 | 3,797.2 | 3,459.0 | 3,414.6 |
| 2% 340m bond | GBP | 2025 | - | - | 331.5 | 328.4 |
| 2.867% 320m bond | HKD | 2026 | 31.6 | 31.9 | 31.2 | 31.8 |
| 2.92% 739m bond | HKD | 2026 | 72.6 | 73.6 | 71.9 | 73.4 |
| 1.129% 52m bond | EUR | 2027 | 42.1 | 42.4 | 42.0 | 41.7 |
| 2.37% 830m bond | HKD | 2027 | 79.1 | 81.5 | 80.4 | 80.4 |
| 5.625% 300m bond | GBP | 2027 | 309.9 | 302.6 | 312.6 | 304.4 |
| 1.43% 100m bond | GBP | 2028 | 89.6 | 89.9 | 87.3 | 87.6 |
| 5.02% JPY 10bn dual currency loan | JPY/USD | 2029 | 60.4 | 62.7 | 64.3 | 66.9 |
| 0.875% 300m bond | GBP | 2029 | 251.3 | 256.9 | 245.1 | 251.6 |
| 2.058% 30m bond | EUR | 2030 | 23.5 | 23.4 | 23.7 | 23.4 |
| 0.175% 11bn bond | JPY | 2030 | 51.9 | 53.6 | 54.2 | 55.2 |
| 2.625% 425m bond | GBP | 2031 | 369.2 | 362.4 | 372.3 | 361.2 |
| 1.641% 30m bond | EUR | 2031 | 22.7 | 22.5 | 22.9 | 22.4 |
| 2.9% 600m bond | HKD | 2031 | 57.5 | 55.8 | 58.3 | 54.0 |
| 1.474% 35m bond | USD | 2031 | 21.4 | 22.1 | 20.9 | 21.6 |
| 1.707% 28m bond | EUR | 2032 | 19.7 | 21.4 | 20.7 | 21.5 |
| 1.653% 26m bond | EUR | 2032 | 18.1 | 19.5 | 19.0 | 19.6 |
| 1.70% 30m bond | EUR | 2033 | 20.8 | 22.9 | 21.9 | 23.0 |
| 3.50% 650m bond | EUR | 2033 | 533.3 | 529.4 | - | - |
| 2.0% 350m bond | GBP | 2033 | 78.0 | 76.9 | 80.3 | 79.1 |
| 3.75% 825m bond | EUR | 2034 | 698.5 | 681.3 | 560.7 | 553.8 |
| 5% 200m bond | GBP | 2035 | 187.2 | 198.5 | 201.0 | 207.1 |
| 4.95% 1.5bn bond | NOK | 2035 | 114.3 | 104.8 | - | - |
| 5.75% 400m bond | GBP | 2036 | 408.4 | 394.9 | 442.1 | 414.6 |
| 1.45% 8.5bn bond | JPY | 2037 | 38.6 | 40.9 | 43.3 | 43.4 |
| 5.25% 400m bond | GBP | 2046 | 217.1 | 225.4 | 251.4 | 248.5 |
| Borrowings designated at fair value through profit and loss | - | - | 330.2 | 330.2 | 338.9 | 338.9 |
| 6.875% 400m bond | USD | 2028 | 330.2 | 330.2 | 338.9 | 338.9 |
| Borrowings measured at amortised cost | - | - | 6123.1 | 6950.7 | 6235.4 | 6697.9 |
| Short-term bank borrowings - fixed | GBP | 2026 | 37.1 | 37.1 | 37.8 | 37.8 |
| 0.49%+RPI 100m IL Loan | GBP | 2025 | - | - | 147.1 | 147.8 |
| 0.013%+RPI 25m IL bond | GBP | 2025 | 38.2 | 38.2 | 36.4 | 36.9 |
| 0.1275%+RPI 100m IL Loan | GBP | 2026 | 150.3 | 151.1 | 143.2 | 145.8 |
| 0.01%+RPI 20m IL bond | GBP | 2028 | 28.7 | 30.4 | 27.5 | 29.5 |
| 1.23%+RPI 50m EIB (amortising) IL loan | GBP | 2029 | 27.9 | 24.5 | 29.4 | 29.5 |
| 0.288%+CPI 100m IL loan | GBP | 2029 | 118.3 | 126.8 | 114.1 | 123.1 |
| 1.29%+RPI 50m EIB (amortising) IL loan | GBP | 2029 | 30.9 | 27.3 | 32.4 | 32.2 |
| 1.12%+RPI 50m EIB (amortising) IL loan | GBP | 2029 | 30.6 | 27.1 | 32.0 | 32.0 |
| 1.10%+RPI 50m EIB (amortising) IL loan | GBP | 2029 | 30.5 | 27.1 | 31.9 | 31.9 |
| 0.75%+RPI 50m EIB (amortising) IL loan | GBP | 2029 | 32.6 | 29.4 | 33.8 | 34.1 |
| 0.76%+RPI 50m EIB (amortising) IL loan | GBP | 2030 | 32.5 | 29.3 | 33.6 | 34.0 |
| 1.15%+RPI 50m EIB (amortising) IL loan | GBP | 2030 | 32.6 | 29.2 | 33.7 | 33.9 |
| 1.11%+RPI 50m EIB (amortising) IL loan | GBP | 2030 | 32.6 | 29.3 | 33.8 | 34.0 |
| 0.780%+SONIA 100m loan | GBP | 2030 | 99.3 | 99.9 | 100.6 | 99.8 |
| 0.178%+RPI 35m IL bond | GBP | 2030 | 50.5 | 53.6 | 49.5 | 51.6 |
| 0.970%+SONIA 135m loan | GBP | 2030 | 132.2 | 134.7 | 134.0 | 134.6 |
| 0.245%+CPI 20m IL bond | GBP | 2031 | 23.3 | 26.8 | 22.9 | 26.0 |
| 0.01%+RPI 38m IL bond | GBP | 2031 | 51.0 | 57.6 | 50.4 | 55.9 |
| 3.375% + RPI 50m IL bond | GBP | 2032 | 119.2 | 109.9 | 122.8 | 106.0 |
| 0.9856%+SONIA 100m EIB (amortising) loan | GBP | 2032 | 43.7 | 43.80 | 50.3 | 50.0 |
| 1.175%+SONIA 100m loan | GBP | 2032 | 100.2 | 99.8 | 101.7 | 99.7 |
| 0.940%+SONIA 150m loan | GBP | 2032 | 146.5 | 149.8 | 148.6 | 149.7 |
| 0.9676%+SONIA 150m EIB (amortising) loan | GBP | 2032 | 70.2 | 70.30 | 80.1 | 79.7 |
| 0.8496%+SONIA 100m EIB (amortising) loan | GBP | 2033 | 49.1 | 50.00 | 55.6 | 56.3 |
| 0.7876%+SONIA 150m EIB (amortising) loan | GBP | 2033 | 80.6 | 79.70 | 90.6 | 89.1 |
| 2% 350m bond | GBP | 2033 | 194.9 | 247.3 | 200.8 | 245.5 |
| 0.01%+RPI 100m EIB (amortising) IL loan | GBP | 2033 | 90.6 | 84.8 | 86.2 | 91.0 |
| 0.01%+RPI 75m EIB (amortising) IL loan | GBP | 2034 | 63.5 | 63.6 | 64.5 | 68.2 |
| 0.01%+RPI 75m EIB (amortising) IL loan | GBP | 2034 | 66.3 | 66.8 | 67.3 | 71.2 |
| 0.01%+RPI 75m EIB (amortising) IL loan | GBP | 2034 | 66.3 | 66.9 | 67.3 | 71.2 |
| 1.9799% + RPI 100m IL bond | GBP | 2035 | 186.2 | 204.4 | 201.4 | 197.4 |
| 1.1496%+SONIA 100m EIB (amortising) loan | GBP | 2035 | 66.3 | 65.60 | 73.4 | 71.9 |
| 1.1166%+SONIA 75m EIB (amortising) loan | GBP | 2035 | 52.9 | 51.60 | 58.3 | 56.2 |
| 0.01%+RPI 26.5m IL bond | GBP | 2036 | 32.1 | 41.8 | 32.3 | 40.7 |
| 0.379%+CPI 20m IL bond | GBP | 2036 | 20.9 | 26.7 | 21.6 | 26.0 |
| 0.01%+RPI 29m IL bond | GBP | 2036 | 34.2 | 44.3 | 35.5 | 42.9 |
| 0.093%+CPI 60m IL bond | GBP | 2037 | 60.3 | 79.8 | 62.2 | 77.5 |
| 1.66%+RPI 35m IL bond | GBP | 2037 | 62.4 | 66.0 | 63.8 | 63.7 |
| 1.75% 400m bond | GBP | 2038 | 249.7 | 353.3 | 219.9 | 301.8 |
| 5.125% 300m bond | GBP | 2038 | 279.4 | 297.5 | 306.3 | 297.4 |
| 2.40%+RPI 70m IL bond | GBP | 2039 | 125.2 | 128.9 | 130.8 | 124.4 |
| 1.7829% + RPI 100m IL bond | GBP | 2040 | 165.3 | 202.2 | 192.0 | 195.3 |
| 0.01%+CPI 125m IL bond | GBP | 2040 | 104.4 | 171.6 | 111.9 | 168.3 |
| 1.3258% + RPI 50m IL bond | GBP | 2041 | 76.3 | 100.9 | 87.6 | 97.4 |
| 1.5802%+ RPI 100m IL bond | GBP | 2042 | 156.0 | 201.6 | 181.1 | 194.7 |
| 1.875% 300m bond | GBP | 2042 | 168.3 | 296.0 | 191.4 | 295.8 |
| 1.5366% + RPI 20m IL bond | GBP | 2043 | 31.5 | 40.2 | 36.1 | 38.9 |
| 5.25% 400m bond | GBP | 2046 | 130.2 | 150.0 | - | - |
| 1.397% + RPI 50m IL bond | GBP | 2046 | 71.0 | 100.8 | 84.7 | 97.3 |
| 0.359%+CPI 32m IL bond | GBP | 2048 | 24.8 | 42.0 | 27.6 | 40.8 |
| 1.7937% + RPI 50m IL bond | GBP | 2049 | 75.5 | 100.3 | 91.4 | 96.9 |
| 5.75% 350m bond | GBP | 2051 | 332.0 | 336.1 | - | - |
| Commission for New Towns (amortising) loan - fixed | GBP | 2053 | 31.3 | 22.9 | 35.3 | 23.9 |
| 1.847% + RPI 100m IL bond | GBP | 2056 | 176.5 | 199.1 | 187.0 | 192.2 |
| 1.815% + RPI 100m IL bond | GBP | 2056 | 174.8 | 198.3 | 181.6 | 191.4 |
| 1.662% + RPI 100m IL bond | GBP | 2056 | 171.1 | 197.9 | 177.6 | 191.0 |
| 1.5865% + RPI 50m IL bond | GBP | 2056 | 84.7 | 98.9 | 89.6 | 95.4 |
| 1.591% + RPI 25m IL bond | GBP | 2056 | 41.4 | 49.3 | 44.6 | 47.6 |
| 1.556% + RPI 50m IL bond | GBP | 2056 | 84.3 | 98.4 | 89.2 | 94.9 |
| 1.435% + RPI 50m IL bond | GBP | 2056 | 82.6 | 98.0 | 87.2 | 94.6 |
| 1.3805% + RPI 35m IL bond | GBP | 2056 | 57.4 | 68.6 | 60.6 | 66.2 |
| 1.585% + RPI 100m IL bond | GBP | 2057 | 160.9 | 190.4 | 172.1 | 183.8 |
| 0.387%+CPI 33m IL bond | GBP | 2057 | 23.7 | 43.0 | 25.6 | 41.7 |
| 1.702% + RPI 50m IL bond | GBP | 2057 | 83.1 | 96.0 | 86.7 | 92.7 |
| Amounts owed to intermediate parent undertakings | GBP | Various | 291.3 | 291.3 | 452.1 | 452.1 |
| Bank overdrafts | GBP | 2025 | 3.6 | 3.6 | 19.8 | 19.8 |
| Lease obligations | GBP | Various | 81.3 | 81.3 | 57.2 | 57.2 |
| - | - | - | 10,270.1 | 11,078.1 | 10,033.3 | 10,451.4 |
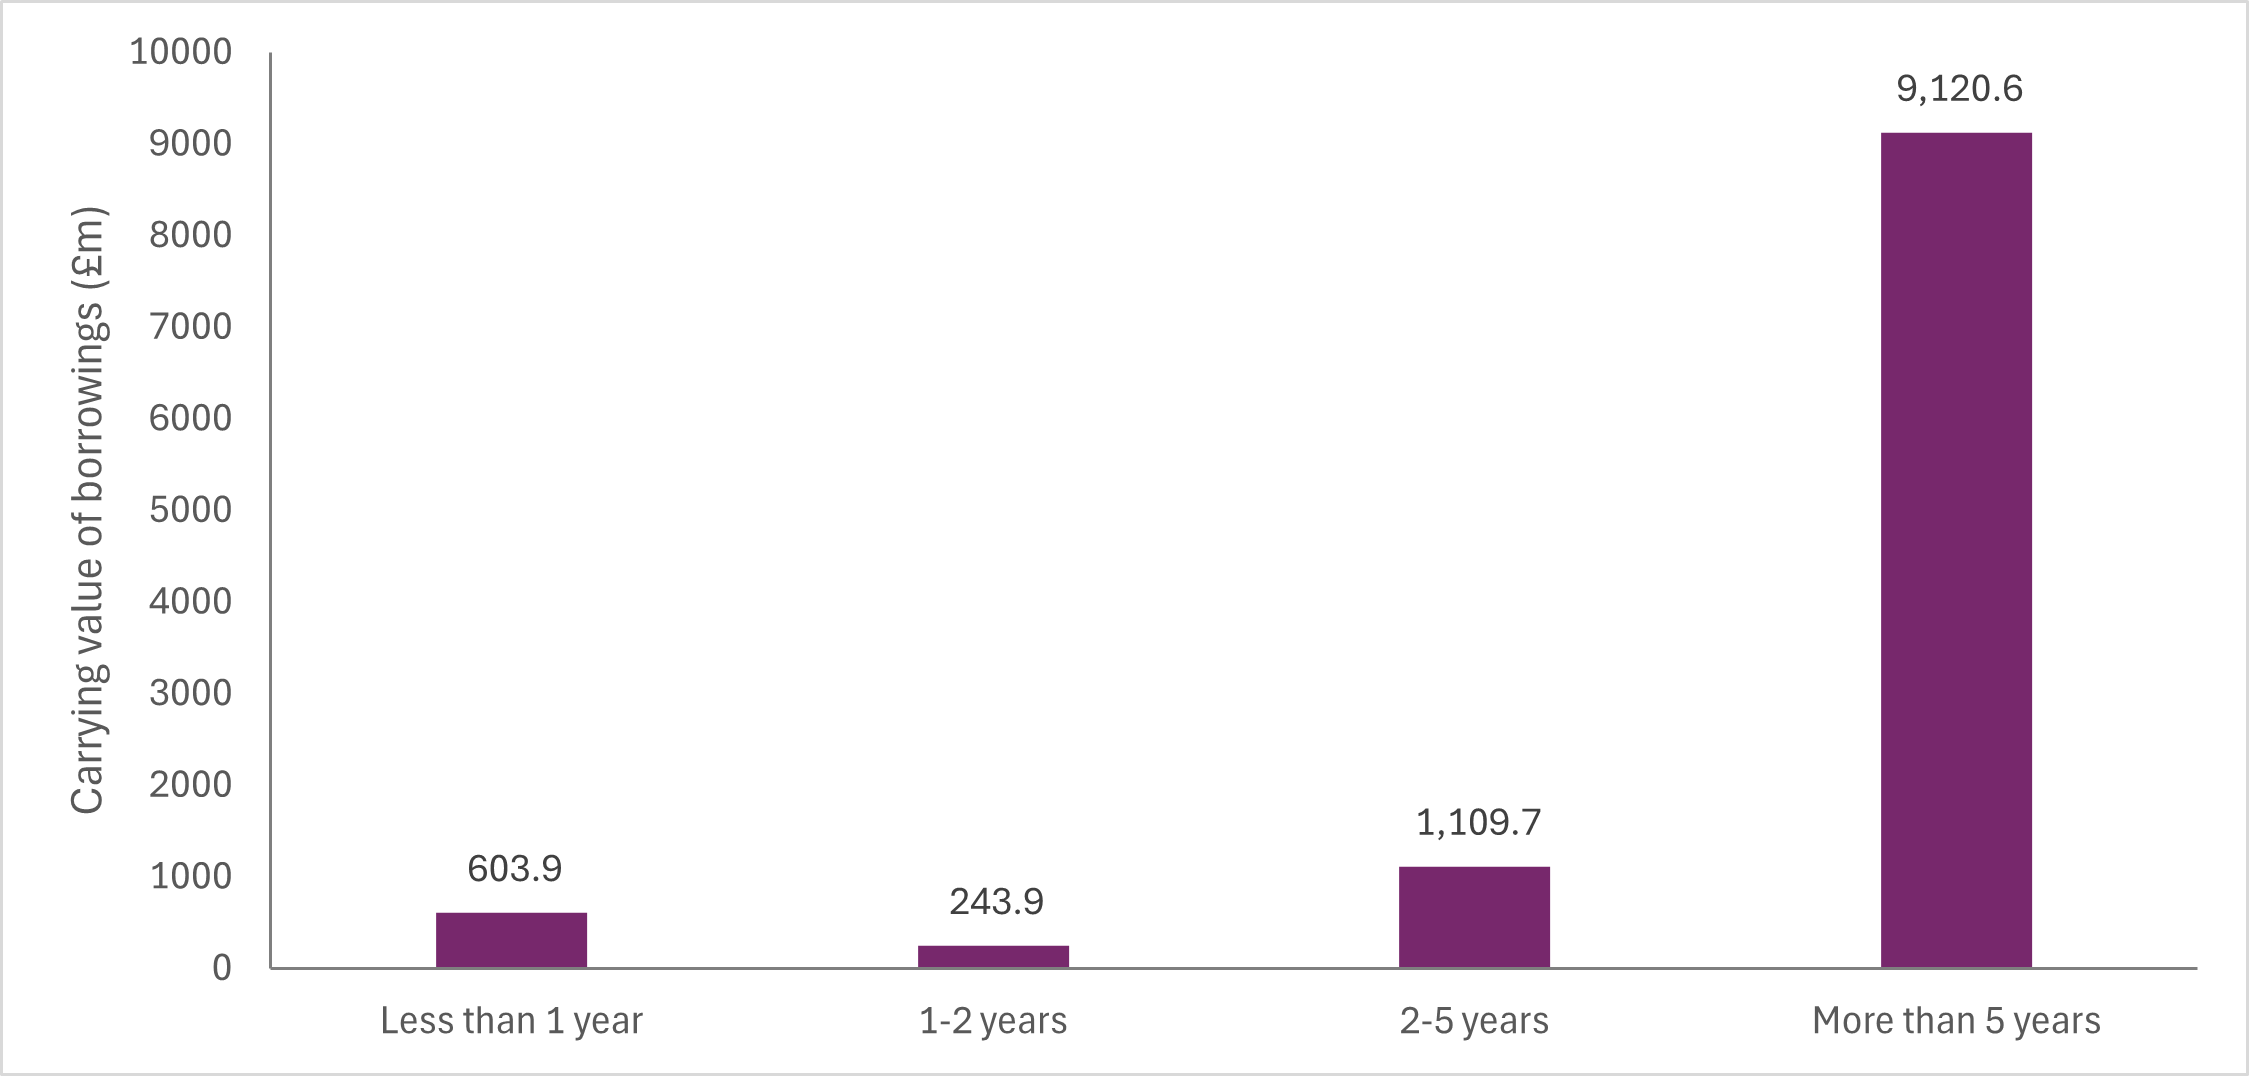
Debt maturities
United Utilities Water Limited (unaudited)
| Scheduled debt maturities (GBPm) | At 31 March 2025 |
|---|---|
| Less than 1 year | 603.9 |
| 1-2 years | 243.9 |
| 2-5 years | 1,109.7 |
| More than 5 years | 9,120.6 |
| Total | 11,078.1 |